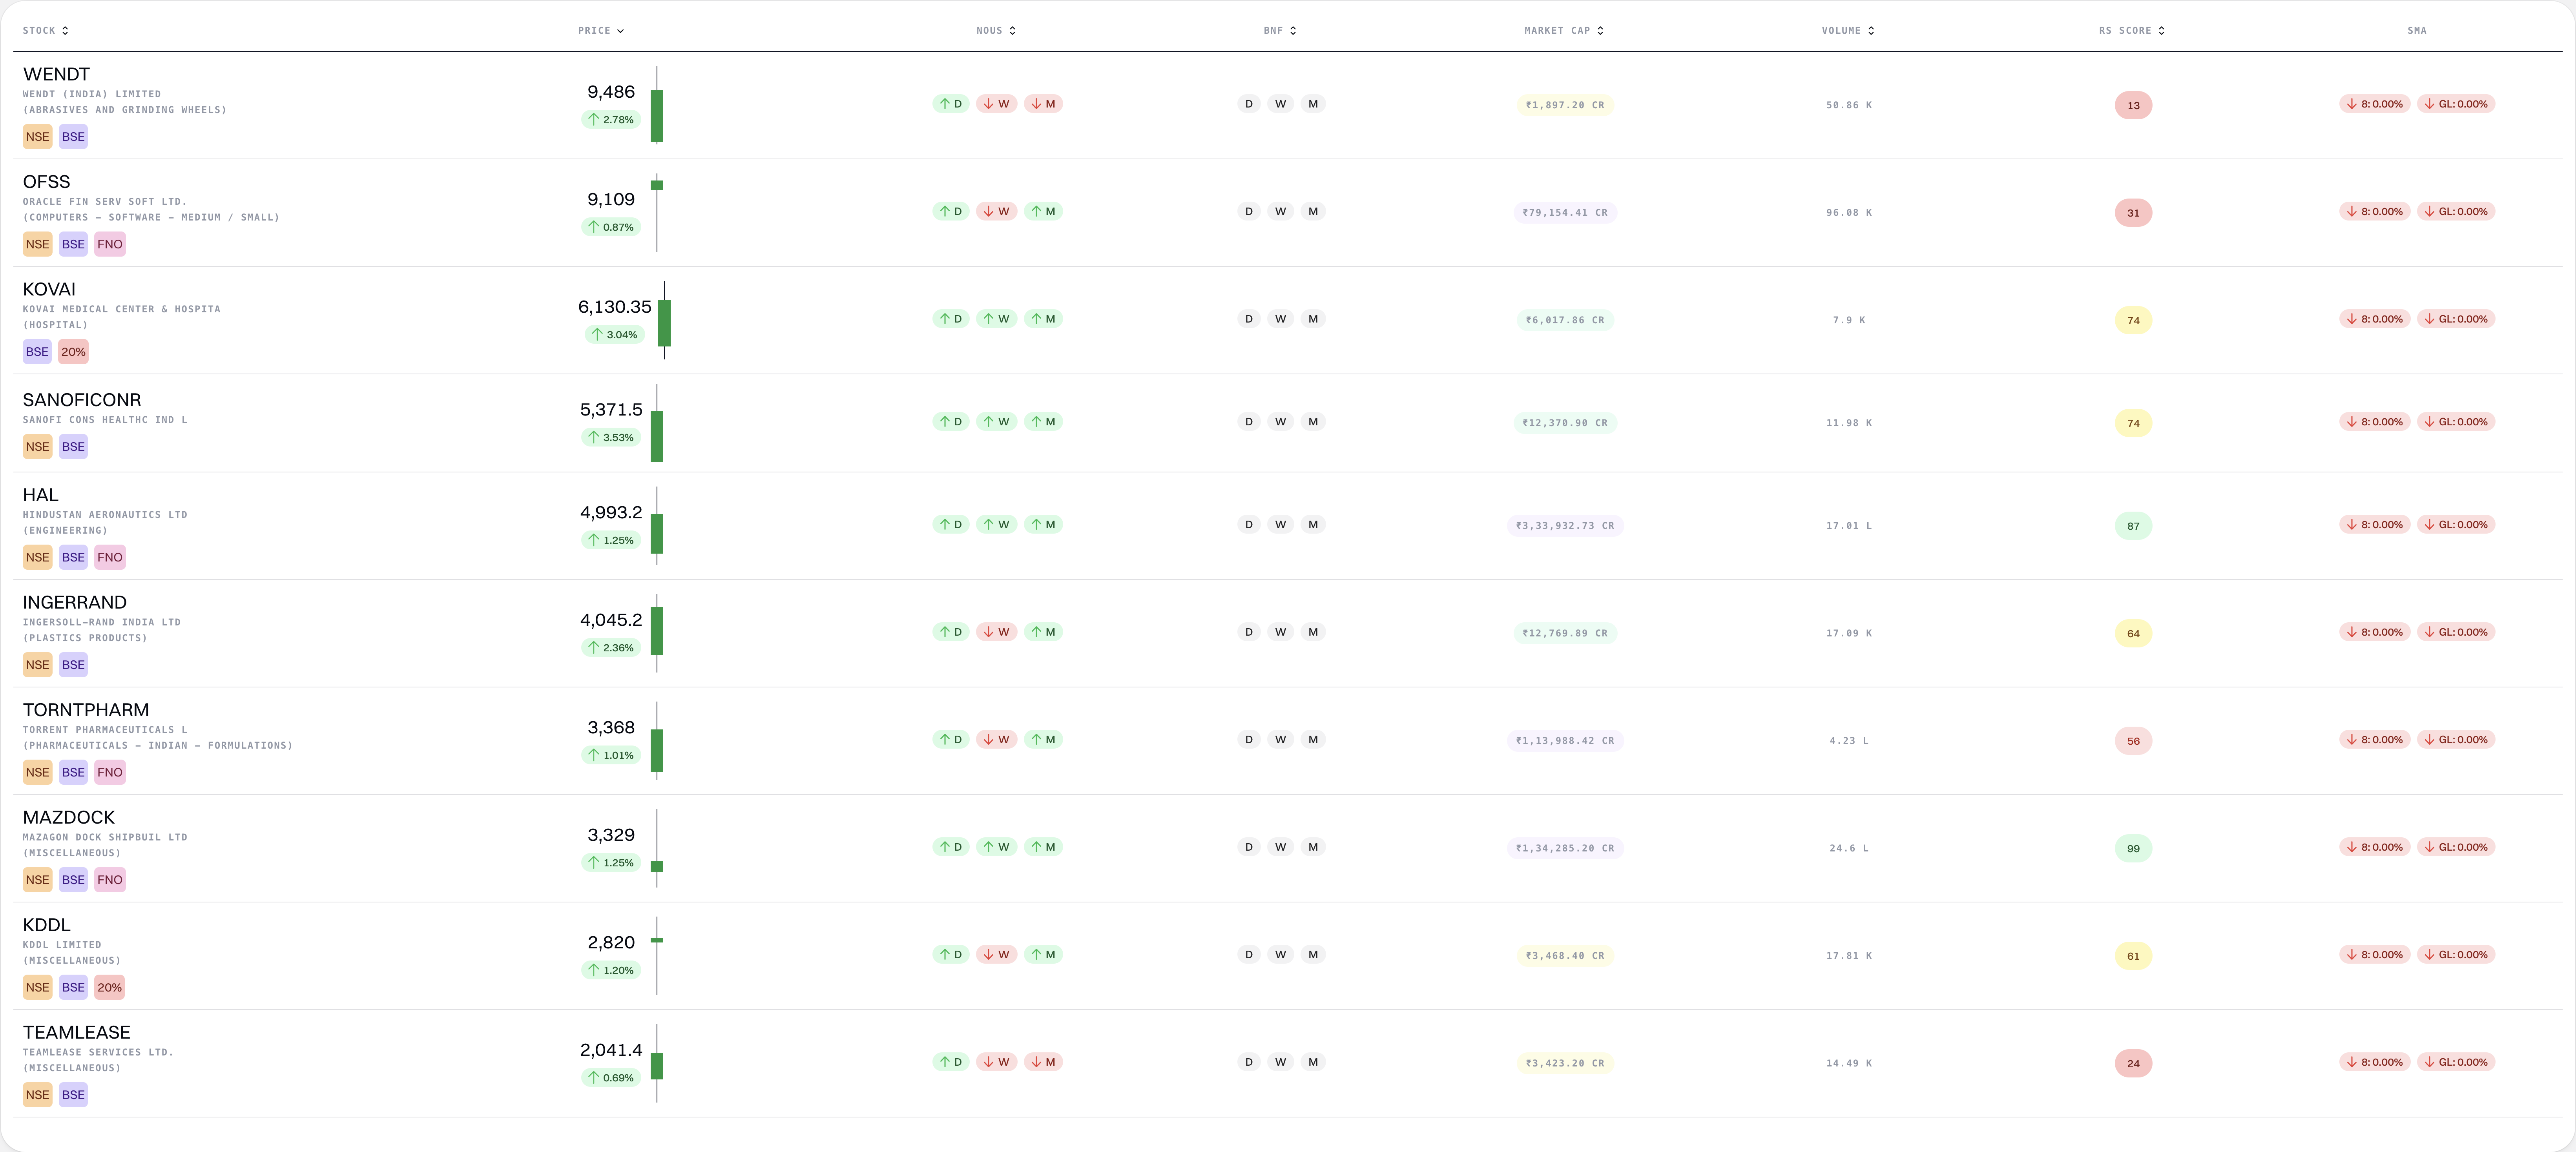
Picking out performing stocks has never been easier.

Know the pulse of the market.
Market Pulse
ROC
Rate of Change
The Rate of Change (ROC) is a technical indicator that measures the percentage change in price over a specified period. It is calculated by dividing the current price by the price n periods ago and multiplying by 100. The ROC is used to identify overbought or oversold conditions in the market.
Net New Highs
Market Momentum
Net New Highs tracks the difference between stocks making new 52-week highs versus new 52-week lows. This indicator helps identify market momentum and sentiment, showing whether the market is trending bullish or bearish.
Daily Movers
Stocks Up 4.5% Today
Number of stocks that have gained 4.5% or more in today's trading session. This metric helps identify strong momentum and potential breakout candidates.
Daily Decliners
Stocks Down 4.5% Today
Number of stocks that have declined 4.5% or more in today's trading session. This metric helps identify weak momentum and potential breakdown candidates.
5-Day Winners
Stocks Up 20% in 5 Days
Number of stocks that have gained 20% or more over the past 5 trading days. This metric identifies stocks with strong short-term momentum and potential continuation patterns.
Market Pulse
Check out how the market moved today
SMA Analysis
All SMA Above/Below Analysis
Comprehensive view of stock distribution across key Simple Moving Averages (21, 55, 200). This analysis helps identify overall market strength and trend direction by showing how many stocks are trading above or below these critical technical levels.
Short-term Strength
Stocks Above 8 SMA
Number of stocks trading above their 8-day Simple Moving Average. This short-term indicator helps identify stocks with immediate momentum and potential short-term trading opportunities.
Long-term Trend
Stocks Above 200 SMA
Number of stocks trading above their 200-day Simple Moving Average. This long-term indicator shows overall market health and identifies stocks in strong uptrends with solid fundamental support.
Medium-term Trend
55 SMA Analysis
Comprehensive view of stocks trading above and below the 55-day Simple Moving Average. This medium-term indicator helps identify stocks in intermediate trends and potential trend reversals.