Financial markets run on who has the more AUM, that's how people keep score but remember AUM can come from distribution edge also and that will not get same respect as someone gathering AUM due to outperformance. Everyone at the end of the day invests to make money and thus it is natural the one who is giving better returns ends up with more money to manage. This is the underlying philosophy of relative strength and NOUS.
What is NOUS?
NOUS is a relative strength momentum indicator that measures how well a specific security (e.g., a stock or ETF or a commodity) is performing compared to its benchmark.
- In the
Indian stock market, NOUS uses afixed benchmark — the Nifty 500 index— for all broad-market comparisons - It operates with
fixed parameters Benchmark:Nifty 500Time Period:Always 55 candlesTimeframes:Daily, Weekly, Monthly
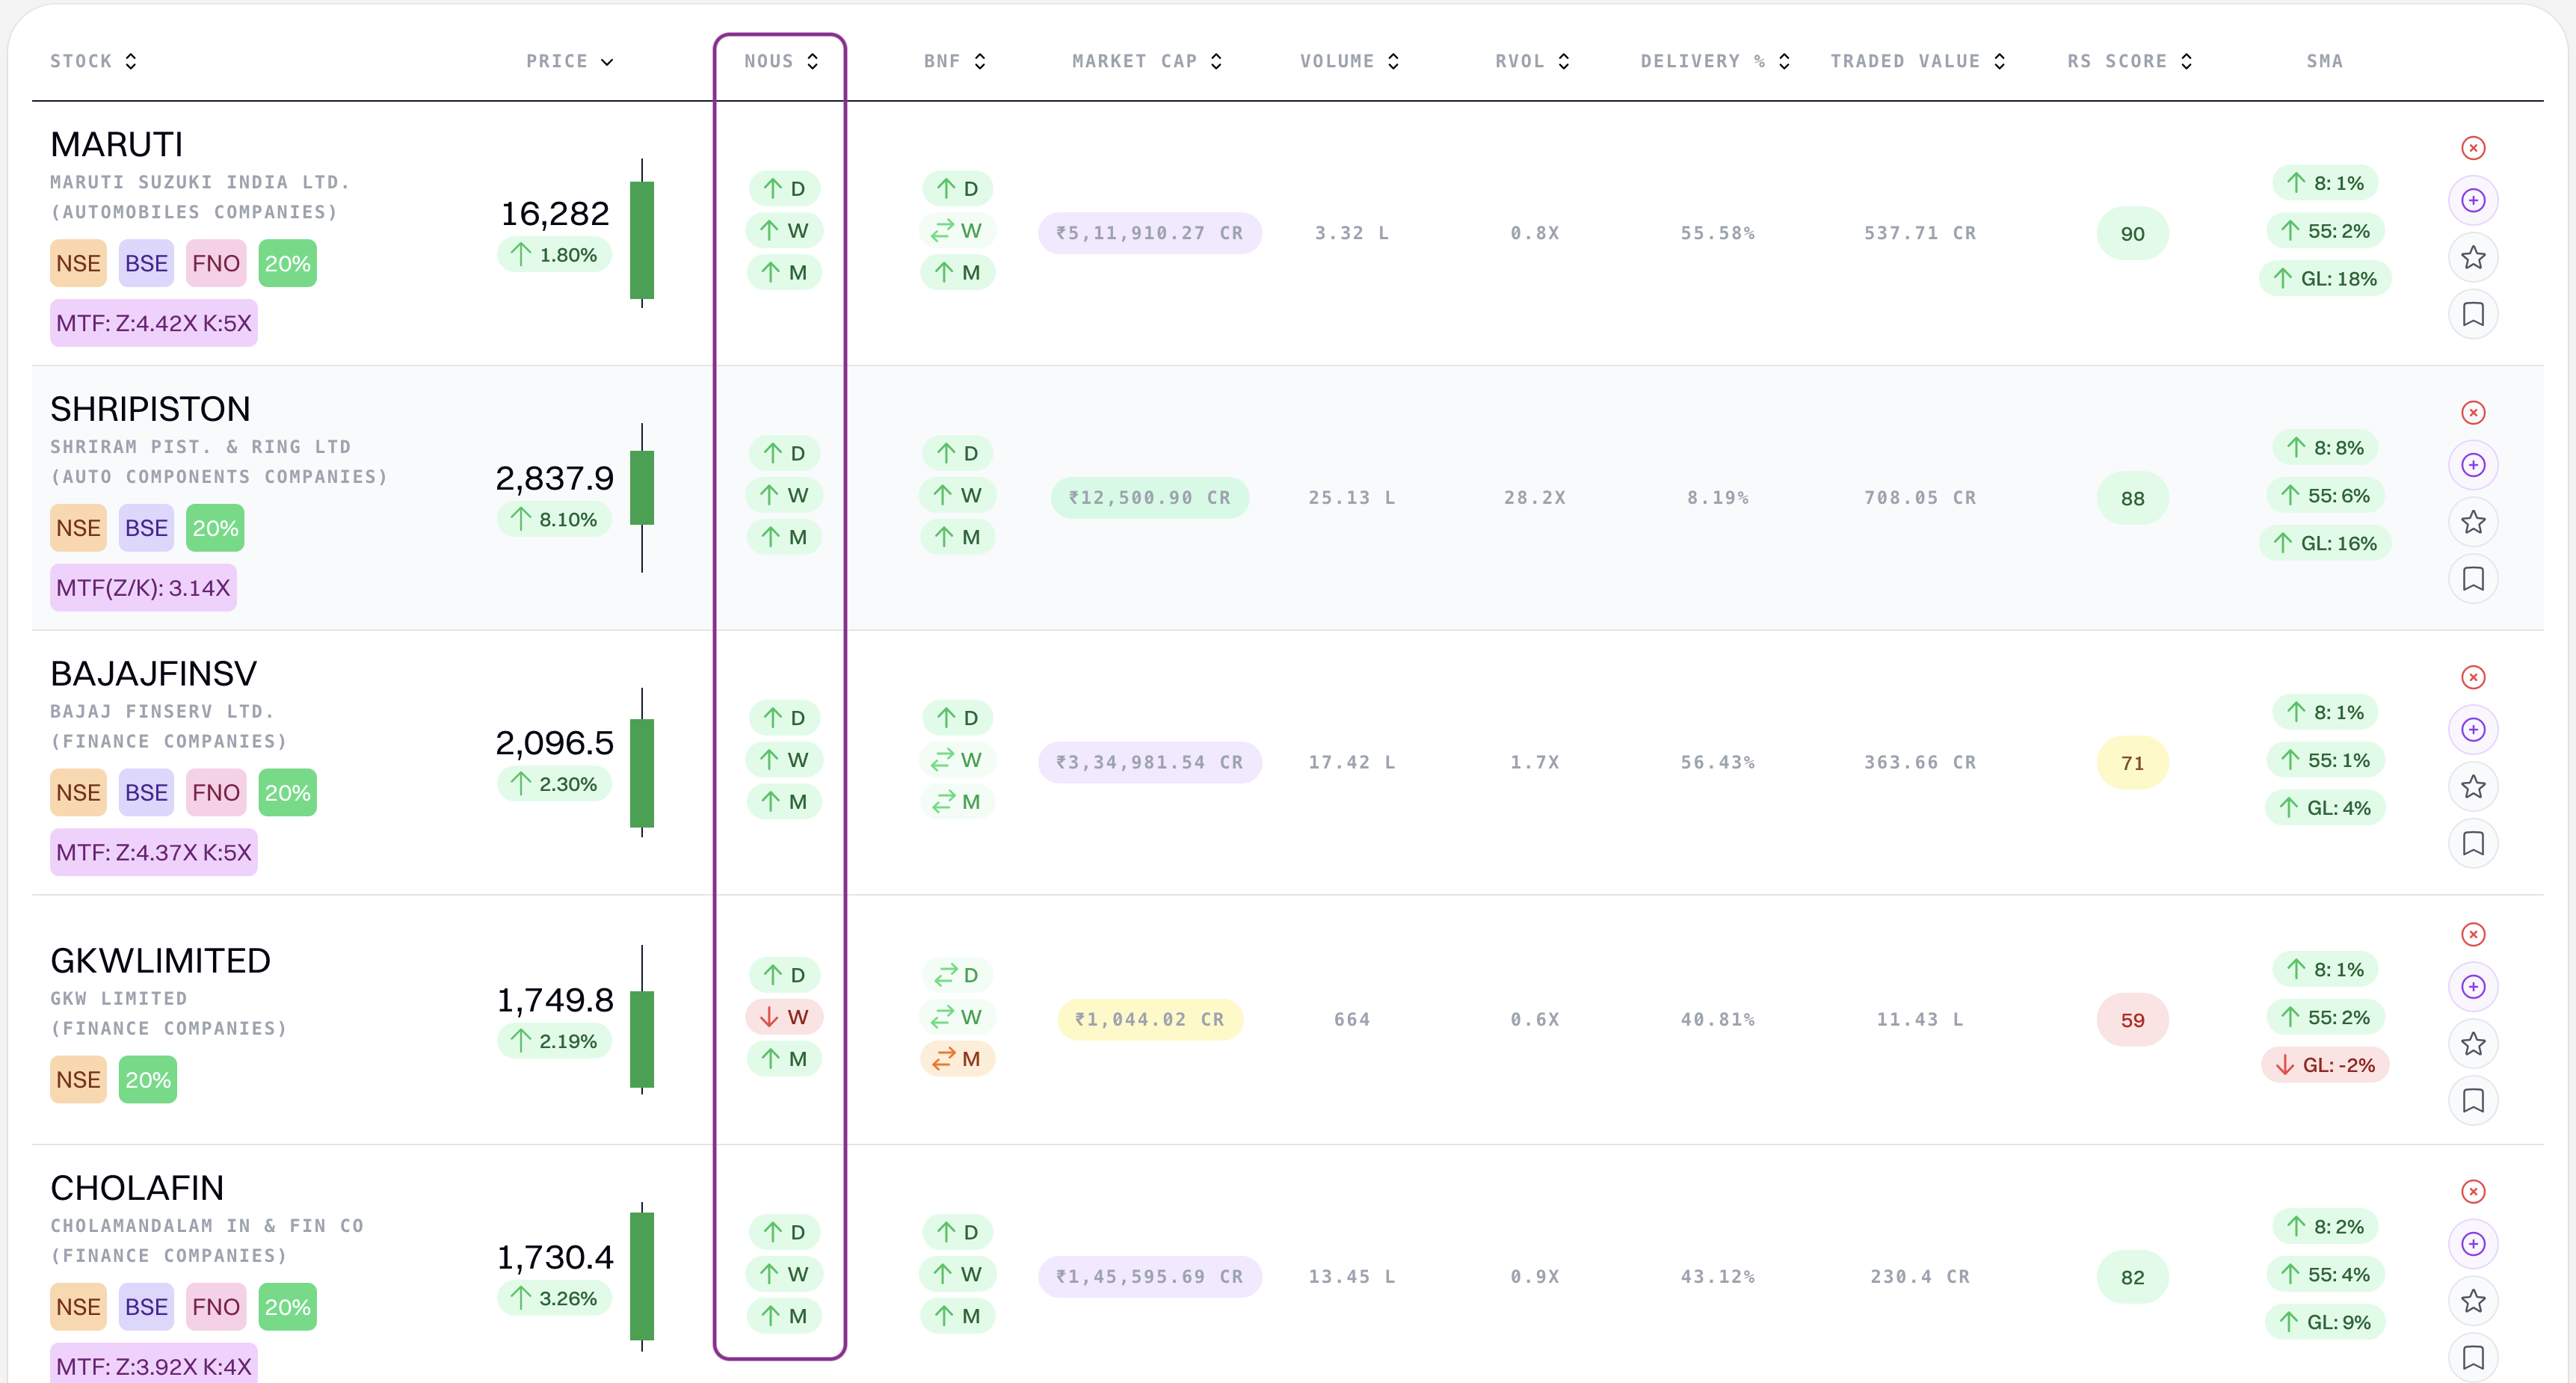
NOUS helps identifyoutperformers(beating the Nifty 500) andunderperformers(lagging it) using color signals and a numerical score.
How Does NOUS Work?
NOUS evaluates relative performance over 55 candles across three fixed timeframes:
Daily (D)Weekly (D)Monthly (M)
Signal Logic (Fixed Rule):
GREEN:The stock isoutperformingthe Nifty 500 over the last 55 candles in that timeframe
—> Relative performance isaboveits 55-period averageRED:The stock isunderperformingthe Nifty 500
—> Relative performance isbelowits 55-period average
Example:NOUS Daily = GREEN→ The stock has outperformed theNifty 500over thelast 55 daily candlescompared to its own historical relative strength.
What is the NOUS Score?
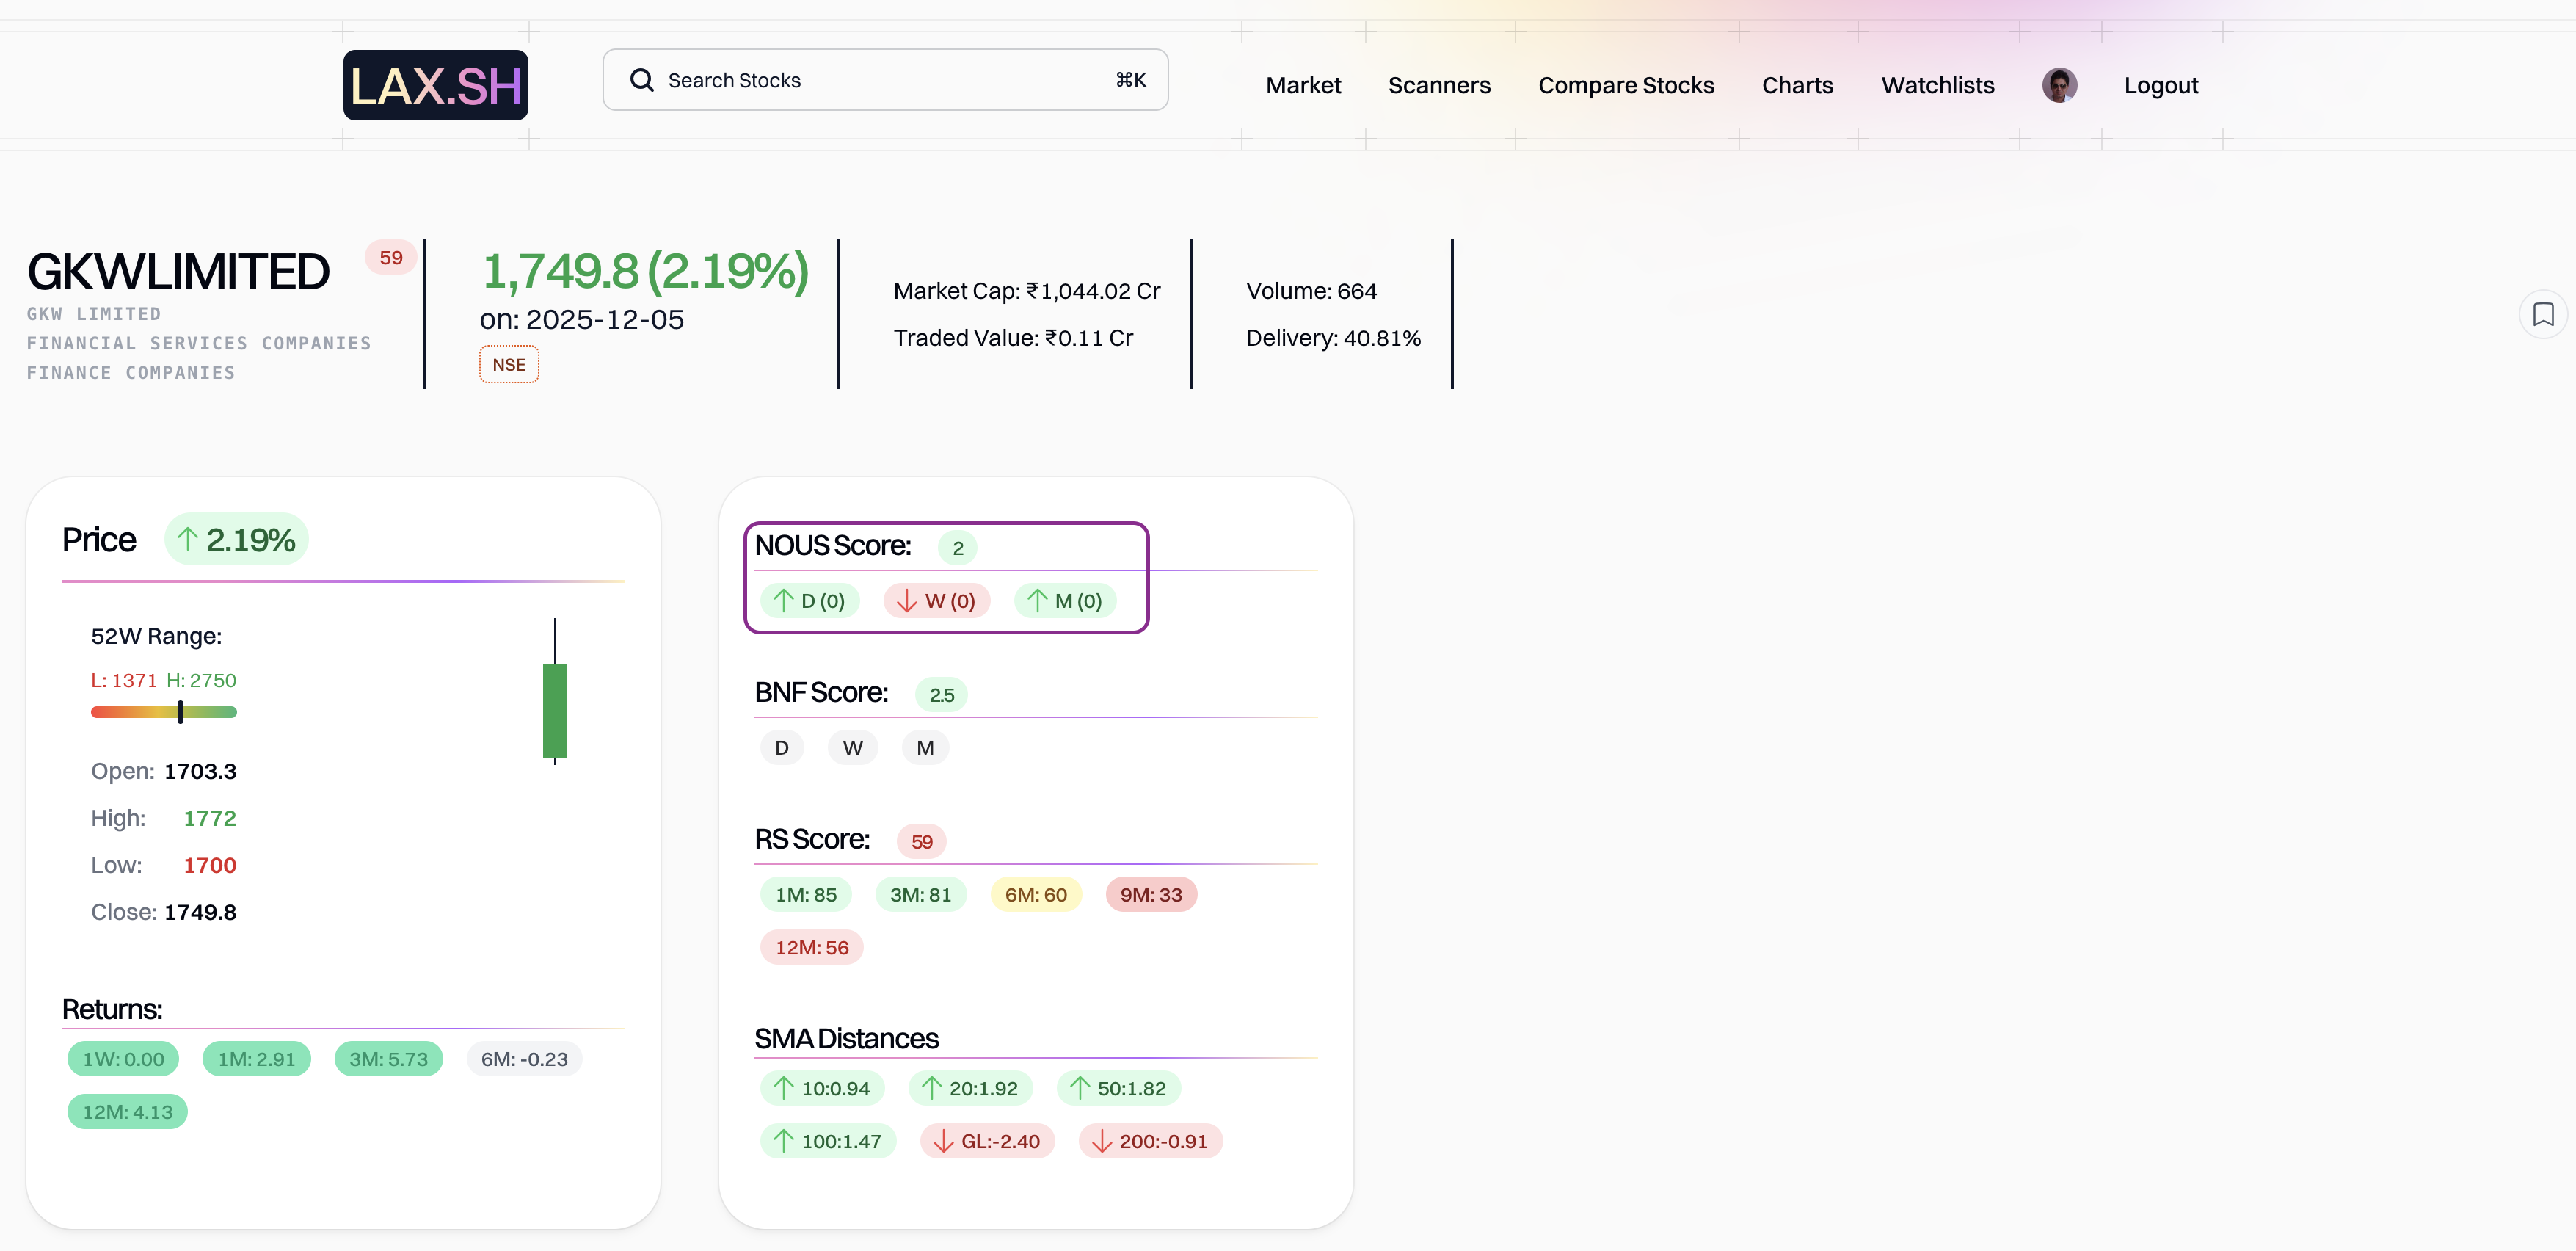
The NOUS Score is a composite momentum rating ranging from -6 to +6, based on the status of Daily, Weekly, and Monthly signals.
Fixed Scoring Weights:
| Timeframe | Weight | Green | Red |
|---|---|---|---|
| Monthly | ×3 | +3 | -3 |
| Weekly | ×2 | +2 | -2 |
| Daily | ×1 | +1 | -1 |
All Possible NOUS Scores
| NOUS Score | Combination (MWD) | Interpretation |
|---|---|---|
| 6 | Green, Green, Green | Maximum Strength |
| 4 | Green, Green, Red | Very Strong |
| 2 | Green, Red, Green | Strong |
| 0 | Red, Green, Green | Minimum Bullish Threshold |
| 0 | Green, Red, Red | Minimum Bearish Threshold |
| -2 | Red, Green, Red | Weak |
| -4 | Red, Red, Green | Very Weak |
| -6 | Red, Red, Red | Maximum Weakness |
How to Use NOUS Score in Trading/Investing?
Buy/Hold only if NOUS Score ≥ +3
→ At leasttwo timeframes must be GREEN
| NOUS Score | Signal | Recommended Action |
|---|---|---|
| +6 to +3 | Bullish Momentum | Buy / Hold |
| +2 to -2 | Neutral / No Trend | Avoid New Positions |
| -3 to -6 | Bearish Momentum | Sell / Avoid |
Practical Tips:
Screening:Use NOUS≥ +3to find stocksbeating the Nifty 500in momentumEntry:Best whenDaily turns Green(Daily NOUS Crossover) while Weekly & Monthly are already Green → Buying the dip in a strong trend.Exit:Monthly turns Red→ Strongsell signal(long-term breakdown)Weekly turns Red→ Intermediatecautionspecially for positional trades
Avoid:Stocks withNOUS ≤ -3, even if undervalued — they arelagging the market
Visual Example
| Timeframe | Status | Color | Points |
|---|---|---|---|
| Monthly | Outperform | 🟢 | +3 |
| Weekly | Outperform | 🟢 | +2 |
| Daily | Underperform | 🔴 | -1 |
| NOUS Score | +4 → Strong Buy Zone |
Key Takeaways
| Point | Summary |
|---|---|
| Benchmark | Fixed: Nifty 500 |
| Period | Fixed: 55 candles |
| Timeframes | Daily, Weekly, Monthly |
| Signal | Green = Outperforming Nifty 500 |
| Score Range | -6 to +6 (7 possible values) |
| Buy Rule | NOUS ≥ +3 (≥2 timeframes Green) |
Pro Tip: Use NOUS as a momentum filter — combine with price structure and volume for better results like SBD and SVD
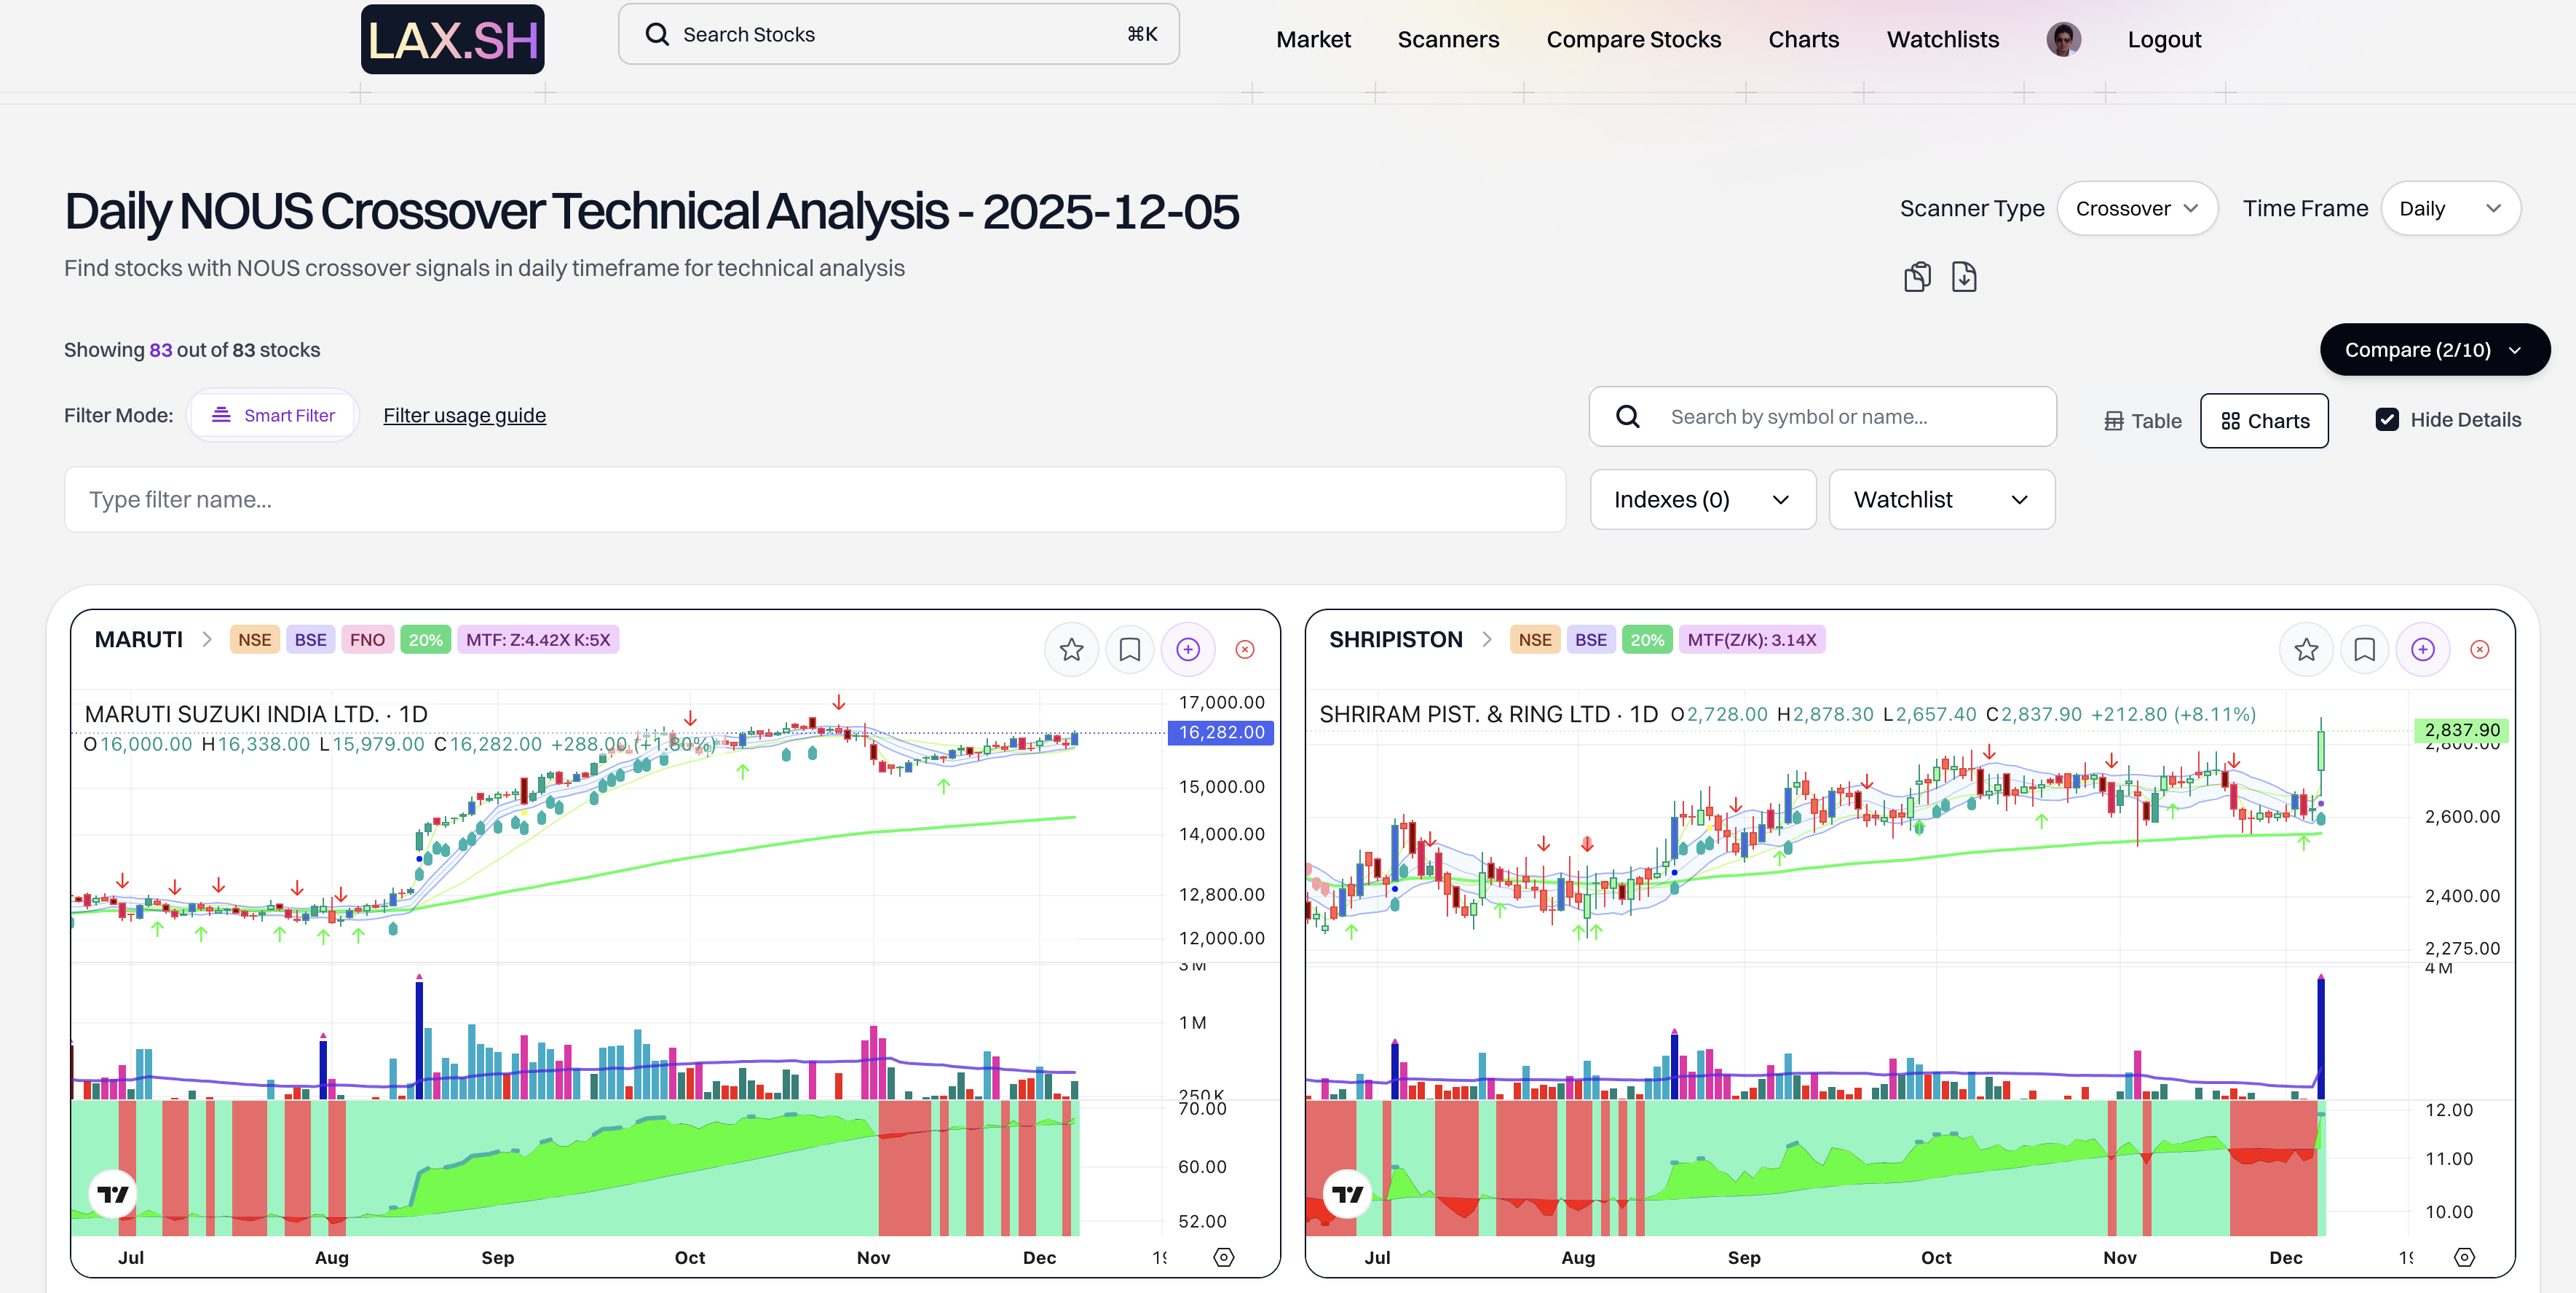
Try to explain what the above scanner output represents and how you can use it. Want a ready-made screener logic for NOUS? Go To NOUS Scanner